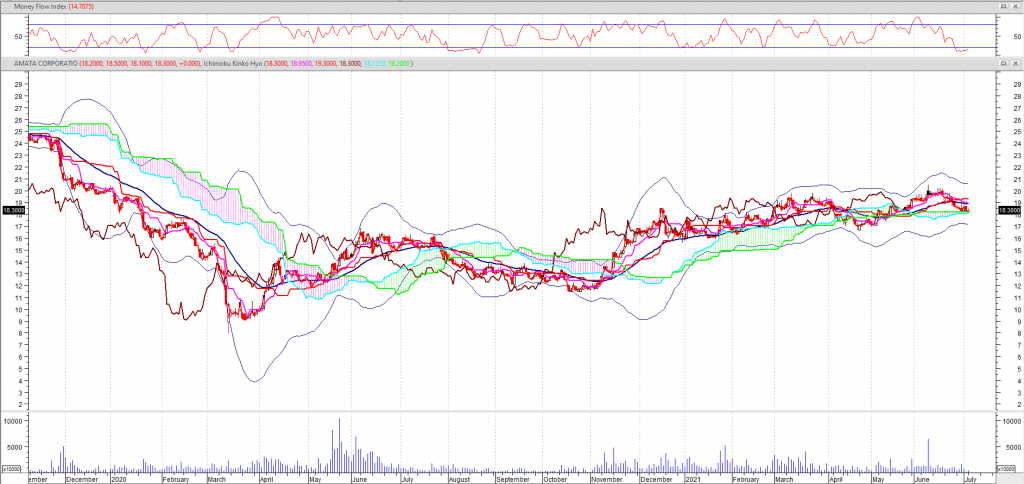
Price Target 30 Baht
This is the big Covid Recovery stock:
Amata specializes in planning, developing, managing, and marketing integrated industrial estates. The company strives not only to provide a location for businesses, but to create integrated cities with a range of services designed to support its client companies and the people who work for them. This means there is an international standard road system, a private security system that incorporates support from local police, reliable utilities and waste disposal facilities, well-maintained green areas and ready built factories for those who want to immediately get up and running.
Leveraging on its solid track record in Thailand, Amata established in 1994 its first overseas integrated industrial estate on 700 hectares in Bien Hoa City, Vietnam. Strategically located on Highway No. 1, connecting the South and the North of Vietnam, Amata City Bien Hoa Industrial park proudly houses multinational corporations with a total investment of well over US$2,4 billion and a total workforce of more than 48,000 workers.
Flagship projects include:
- Amata City Chonburi, Thailand
- Amata City Rayong, Thailand
- Amata City Bien Hoa, Vietnam
- Amata City Long Thanh, Vietnam
- Amata City Halong, Vietnam


Technical Outlook
Short Term: Neutral
Intermediate Term: Bearish
Long Term: Bullish
The projected upper bound is: 39.12.
The projected lower bound is: 17.50.
Relevant news:
February 2, 2021: Thailand’s Amata halts Myanmar property project after coup. Thailand’s largest industrial estate developer has suspended work on a $1 billion project in Myanmar due to fears that the military coup and possible international sanctions will drive investors away from the country.
AMATA is currently 11.4% above its 200-period moving average and is in an downward trend. Volatility is low as compared to the average volatility over the last 10 periods. Our volume indicators reflect volume flowing into and out of AMATA.BK at a relatively equal pace (neutral). Our trend forecasting oscillators are currently bearish on AMATA.BK and have had this outlook for the last 5 periods. The security price has set a new 14-period low while our momentum oscillator has not. This is a bullish divergence.
AMATA closed unchanged at 18.300. Volume was 56% below average (consolidating) and Bollinger Bands were 2% wider than normal.
Open High Low Close Volume
18.200 18.500 18.100 18.300 6,122,100

Moving Averages: 10-period 50-period 200-period
Close: 18.70 18.50 16.42
Volatility: 18 28 51
Volume: 9,278,280 12,377,823 13,784,462
Short-term traders should pay closer attention to buy/sell arrows while intermediate/long-term traders should place greater emphasis on the Bullish or Bearish trend reflected in the lower ribbon.
Momentum
Stochastic Oscillator
One method of interpreting the Stochastic Oscillator is looking for overbought areas (above 80) and oversold areas (below 20). The Stochastic Oscillator is 29.1666. This is not an overbought or oversold reading. The last signal was a buy 1 period(s) ago.
Relative Strength Index (RSI)
The RSI shows overbought (above 70) and oversold (below 30) areas. The current value of the RSI is 38.56. This is not a topping or bottoming area. A buy or sell signal is generated when the RSI moves out of an overbought/oversold area. The last signal was a sell 11 period(s) ago.
Commodity Channel Index (CCI)
The CCI shows overbought (above 100) and oversold (below -100) areas. The current value of the CCI is -95. This is not a topping or bottoming area. The last signal was a buy 2 period(s) ago.
MACD
The Moving Average Convergence/Divergence indicator (MACD) gives signals when it crosses its 9 period signal line. The last signal was a sell 10 period(s) ago.
A white body occurred (because prices closed higher than they opened).
During the past 10 bars, there have been 2 white candles and 6 black candles for a net of 4 black candles. During the past 50 bars, there have been 15 white candles and 27 black candles for a net of 12 black candles.
Bollinger Band
On 7/5/2021, AMATA CORPORATIO closed above the lower band by 11.0%.
Bollinger Bands are 7.75% narrower than normal. The current width of the bands (alone) does not suggest anything conclusive about the future volatility or movement of prices.
The recent price action around the bands compared to the action of the Relative Strength Index (RSI) does not suggest any trading opportunities at this time.


