
Economic Calendar and Trading Strategy This Week
CPI Wednesday, PPI Thursday, retail sales Friday, and where the ontology says the value gaps still sit
The market is bullish. That is the starting point, not a caveat.
The S&P 500 closed Friday 7 August at 7,757.64, a record, capping its strongest week since April. The Nasdaq Composite finished at 26,690.62 after a 1.3% Friday. The VIX printed 15.15 on Thursday, which is a calm reading, not a fearful one. There is no crisis to trade around this week. There is a bull market, a heavy data calendar, and a set of positions that are working.
Two of ours did most of the work.
Palantir. We have carried a Buy on $PLTR since June. The KXCO ontology snapshot recorded on 15 July had it at $133.76 with a consensus target of $189. It closed Friday at $172.01 after a 10.32% single session move on second quarter revenue up 93% and US commercial revenue up 149%. That is 28.6% from the recorded snapshot in three weeks. Our Top 5 note published on 5 August marked it at $162.66 and it added 5.7% in the three sessions since.
SpaceX. We published "SpaceX: The AI Company You Might Be Missing" on 22 July, the day $SPCX closed at $115.26. It closed Friday at $133.27, up 15.6%, with a 15.8% move on Friday alone as the first post IPO lockup expired on 6 August without an insider stampede.
Neither of those came from a chart. Both came from the same place: a map of who depends on whom in the AI stack, and a willingness to hold a position that the tape was arguing with.
So this week I am long, and I am selective. Those two things are not in tension. Caution is not fear. Caution is what keeps you in a bull market for the whole of it rather than for the first two thirds. The index is at a record while individual names sit anywhere from 5% to 57% below their highs, and that spread is the entire opportunity set. Buying everything because the tape is green is how a good year gets handed back in a bad fortnight.
Below is the week's calendar, then the value gaps the ontology is actually pointing at, then the names.
The economic calendar, 10 to 14 August 2026
There is no Fed meeting this week. The next FOMC is 15 and 16 September, and it carries a Summary of Economic Projections and a fresh dot plot. Everything printed this week feeds that meeting. Friday's payroll report already put a September cut back on the table, and this week decides whether it stays there.
Monday 10 August. Nothing scheduled that moves a book. Use it to size positions rather than to react.
Tuesday 11 August. The Reserve Bank of Australia decides at 04:30 GMT, with Governor Michele Bullock's press conference an hour later. Relevant to AUD crosses and to the iron ore complex, not to US equities.
Wednesday 12 August, 08:30 ET. US Consumer Price Index for July. This is the week. June came in at 3.5% year on year against a 3.8% consensus, down from 4.2% in May, with the headline index falling 0.4% on the month as energy prices collapsed. Core was flat on the month at 2.6% year on year against 2.9% expected. Two consecutive downside surprises would make a September cut close to fully priced. An upside surprise takes the cut back out, and given three FOMC dissents in July were for higher rates, not lower, the Fed has cover to wait. Germany's final HICP lands earlier the same morning at a previous reading of 2.8%.
Wednesday 12 August, after the close. Cisco reports fiscal fourth quarter results, with the street at about $1.17 a share. Read it for enterprise networking demand and AI order commentary rather than for the headline number.
Thursday 13 August, 08:30 ET. US Producer Price Index for July, alongside the weekly jobless claims. June final demand fell 0.3% on the month but still ran at 5.5% year on year, with final demand energy down 6.4%. Producer prices running two full points above consumer prices is a margin story, and it is the number I would watch most closely for the second half earnings season. If PPI stays hot while CPI cools, somebody is absorbing that gap, and it is not the consumer.
UK preliminary second quarter GDP prints the same morning at a previous reading of 0.6%, and the RBNZ publishes third quarter inflation expectations.
Thursday 13 August, after the close. Applied Materials reports fiscal third quarter results, with consensus around $3.36 adjusted a share on roughly $8.95 billion of revenue, which would be 35.5% earnings growth on the year. For anyone holding semiconductor exposure this is the most informative print of the week. Equipment orders lead chip revenue by two to three quarters, and the late July Nasdaq 100 correction was a chip and memory selloff. Applied Materials tells you whether that selloff was about demand or about positioning.
Friday 14 August, 08:30 ET. US retail sales for July. June was $768.6 billion, up 0.2% on the month and 6.7% on the year, with the control group up 0.5% for a sixth consecutive increase. Gasoline receipts fell 5.3% on cheaper pump prices while non-store retailers rose 1.9% on the month and 14.2% on the year. Watch the control group, not the headline. It is the piece that feeds GDP.
Friday 14 August, 10:00 ET. University of Michigan consumer sentiment, preliminary August. July's final read was 55.2, an 11.5% jump from June and a five month high, though still 11% below a year earlier. Year ahead inflation expectations fell to 4.2% from 4.6%. Sentiment at 55 with the index at a record is one of the stranger divergences in this cycle and it deserves more attention than it gets.
How to trade the week. The structural case for a position does not change at 08:30 on a Wednesday. The entry price does. Use the calendar for timing, not for thesis. Friday's payroll print was the clean example: the argument for gold did not change at 08:29, but the entry got considerably more interesting at 08:31. Our trading and markets desk carries the full calendar with the live prints as they land.
Where the value gaps actually are
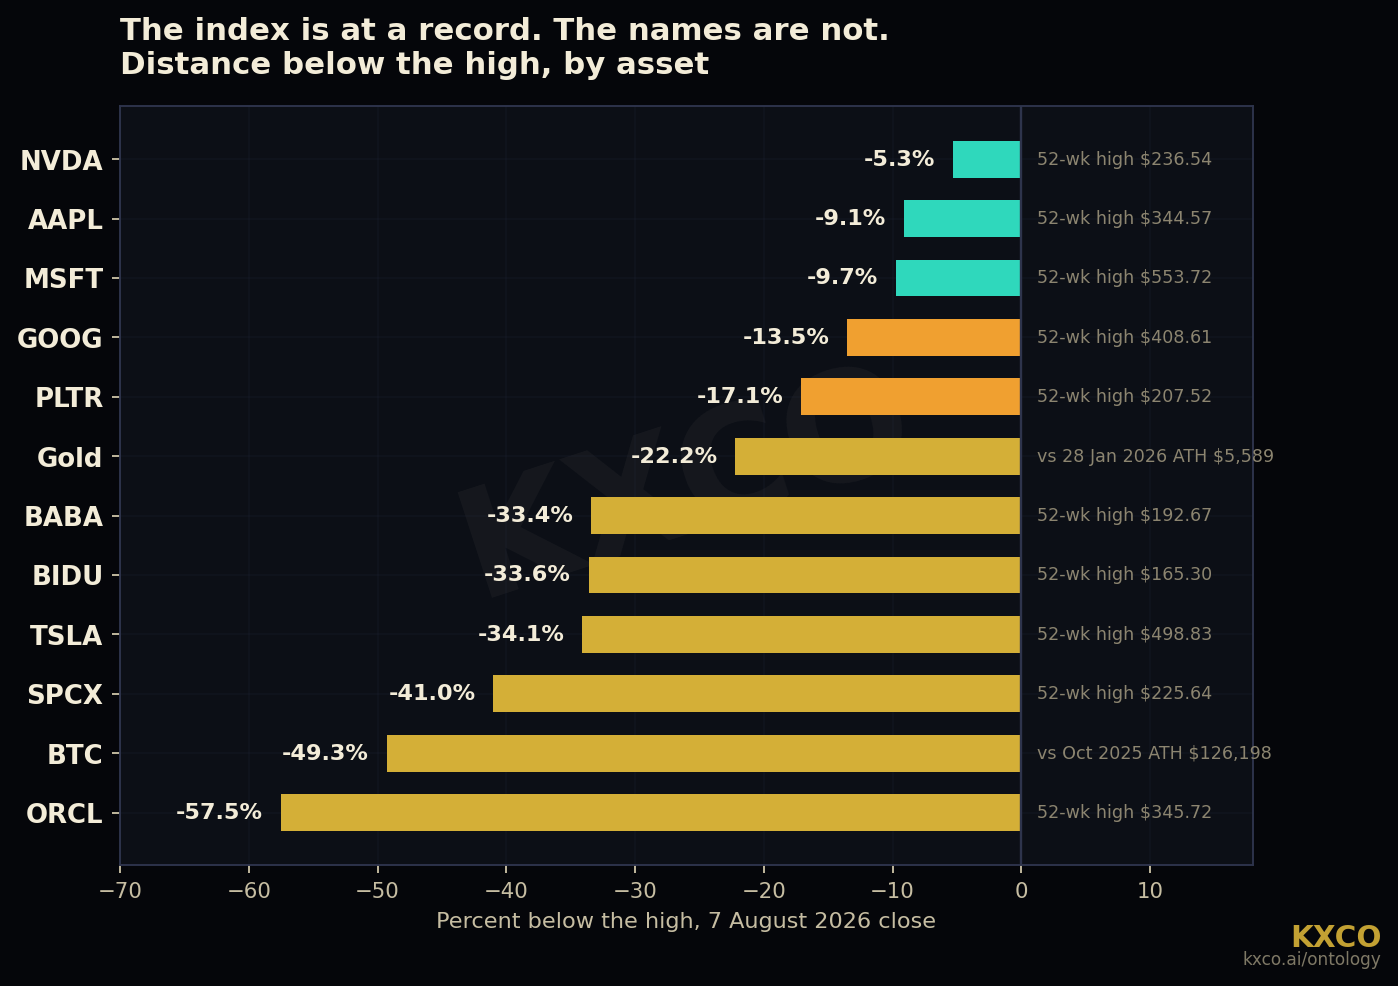
Start with that chart, because it is the argument against buying indiscriminately. Nvidia is 5% below its high. Bitcoin is 49% below its high. Oracle is 57% below its high. Calling all three of those the same trade is how people lose money in a bull market.
Price distance from a high is only half the picture though. A stock can be 50% off its high and still be expensive. What matters is the gap between where a business is priced and what the people who cover it think it is worth, held next to what the structure of the sector says about whether that business can defend its position.
That second half is what the KXCO ontology engine is for, and the live AI sector map is the public working version. As of the 9 August snapshot it carries 345 entities, 769 typed claims, roughly $2.4 trillion of tracked capital flows, 37 ranked findings and 9 chokepoints flagged as single points of failure, filterable across the United States, China, the EU, Taiwan, South Korea, Japan and the Middle East.
I want to be precise about what it does, because this is where most AI marketing overreaches. The engine does not discover anything. It displays structure, with a source, a date and a confidence level attached to every claim, and the analyst does the discovering. That is deliberate. A machine that tells you what to think is a machine you cannot audit. A map that shows what connects to what, and shows its working, is one you can argue with.
Its Analyst Outlook layer carries fourteen majors with consensus targets attached, and it keeps its own history rather than quietly refreshing. Ranked by remaining upside from the map's own snapshot prices, the gaps sit here:
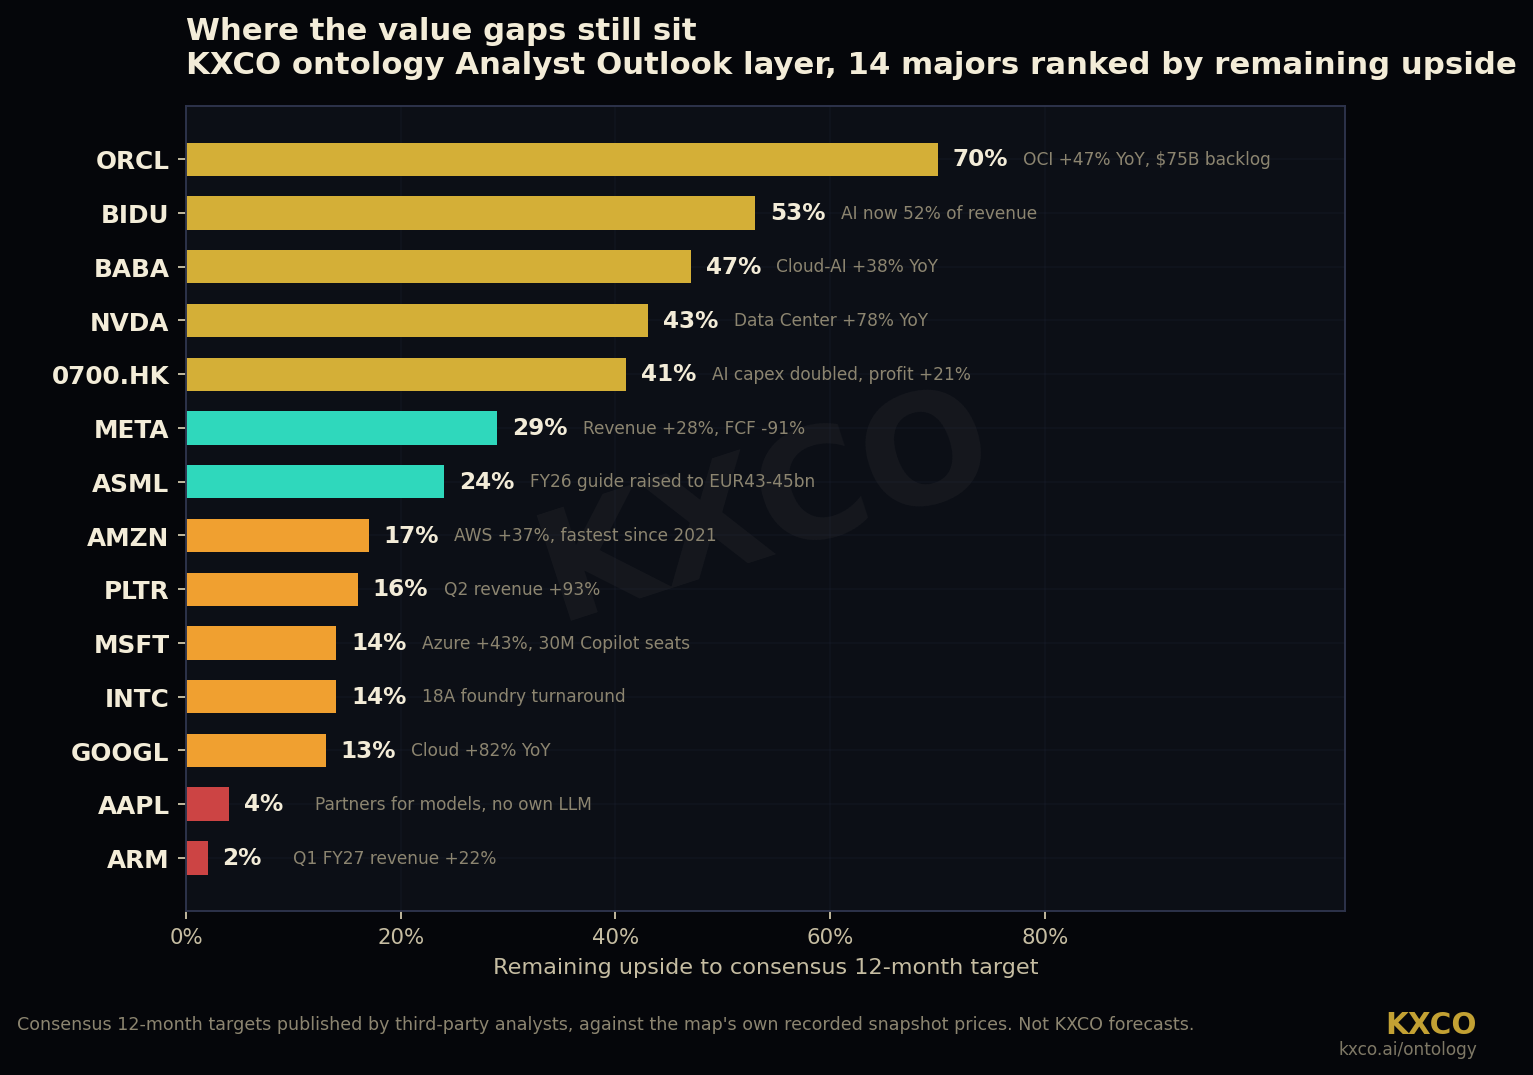
Oracle at 70%. Baidu at 53%. Alibaba at 47%. Nvidia at 43%. Tencent at 41%. Meta at 29%. ASML at 24%. Amazon at 17%. Palantir at 16%. Microsoft and Intel at 14%. Alphabet at 13%. Apple at 4%. Arm at 2%.
Read the bottom of that list as carefully as the top. Apple and Arm are quality businesses with almost no gap left between price and consensus. In a bull market that is exactly where money goes to sit still.
The map also carries five standing opportunity findings, which are the structural version of the same question. Paraphrased short:
Value sits upstream, at the chokepoints. As open weights commoditise the model layer, durable value concentrates in lithography, fabrication, memory and the one GPU vendor, and in energy, which is the binding constraint everyone is racing to secure.
The sovereignty gap. Every participant depends on a stack it does not control: foreign lithography, one chip vendor, rival owned clouds. Japan is the largest worked example, with METI roughly quadrupling its FY2026 AI and semiconductor budget to about Y1.23 trillion.
Japan is the credible second source away from leading edge logic. Rapidus for state backed 2nm, Tower Semiconductor taking up to Y160 billion for silicon photonics and advanced packaging, on top of an existing base in robots, materials and equipment. The diversification is real. The timelines are late decade.
The verification gap. With demand partly marking its own homework through circular deals, trust is the scarce asset. A July breach at Hugging Face could not be fully investigated because the closed AI tools involved blocked forensic analysis.
Provenance and post-quantum for defence AI. AI is moving onto classified networks with unaudited model supply chains. That is the missing layer, and it is the one KXCO built Sentinel for.
Four of those five point upstream or sideways, away from the model layer. One points at Palantir's end of the market. None of them point at buying the index because it went up.
The names
Oracle ($ORCL): the widest gap on the map
Oracle closed Friday at $147.02, up 2.47% on the day, for a $423.5 billion market capitalisation on about 18.3 times forward earnings. Its 52 week range is $114.50 to $345.72, so it sits 57% below its high, the deepest drawdown of any major in this group.
Oracle Cloud Infrastructure revenue is growing 47% year on year against a backlog around $75 billion, and the ontology's consensus target of $248 implies 70% upside. The reason the market has punished it is the shape of that backlog: contracted AI capacity requires enormous capital spending now against revenue that arrives later, and the credit market has started asking who carries that risk. The map flags this directly in its "circular capital moves from equity into credit" finding, which tracks up to $250 billion of vendor backstopping.
That is a real risk and I am not waving it away. It is also priced. A business with a $75 billion backlog trading 57% below its high, on 18 times forward, is being valued as though the backlog does not convert. My position is that some of it converts and the multiple is wrong. This is the widest gap in the group and it carries the most execution risk in the group. Those two facts belong in the same sentence.
Baidu ($BIDU): the cheapest genuine AI asset I can find
BIDU closed at $109.71, 34% below its 52 week high, with a market capitalisation of just $37.2 billion. The trailing GAAP price to earnings ratio of 656 times is noise created by one off items. On forward adjusted earnings the stock trades in the mid teens, and lower still adjusted for net cash. The map's target of $172 implies 53%.
For that you get Apollo Go, which delivered 3.2 million fully driverless rides in the first quarter alone, more than 120% growth year on year, past 20 million cumulative rides by February, operating in 27 cities with more than 330 million autonomous kilometres driven, and testing in Dubai and London. You also get ERNIE 5.1, which ranks first among Chinese models on the LMArena text leaderboard and fourth globally, and a Kunlun accelerator programme that gives Baidu partial insulation from the silicon question that constrains everyone else. AI is now 52% of total revenue.
Compare that robotaxi footprint to Tesla's, then compare the two multiples. The gap is not a judgement about autonomy. It is a judgement about jurisdiction. Sometimes the market is right to apply a jurisdiction discount. It is not right to apply one this large to a business with this much commercial traction.
Alibaba ($BABA): the AI re-rating is real and unfinished
BABA at $128.41 is 33% below its high, on a $292.9 billion market capitalisation and roughly 20 times forward earnings, with a $190 target on the map. Cloud Intelligence external revenue accelerated to 40% growth, AI related product revenue posted triple digit growth for an eleventh consecutive quarter, and Qwen's consumer interface passed 300 million monthly active users.
The counterweight is margin. Adjusted EBITA fell 84% year on year to RMB 5.1 billion as Alibaba spent to hold its position in models and cloud. That is a deliberate trade and I think it is the right one, but it makes the re-rating conditional. BABA works if cloud growth converts to group cash flow. It stalls if it does not. Own it as a position with a thesis you check quarterly, and the next check is the 28 August print.
Nvidia ($NVDA): expensive company, cheap multiple
Nvidia closed Friday at $223.96 with a market capitalisation of $5.42 trillion, which makes it the most valuable listed company in the world again. It is 5% below its 52 week high, so there is no price dip here. What there is instead is a multiple that does not match the narrative.
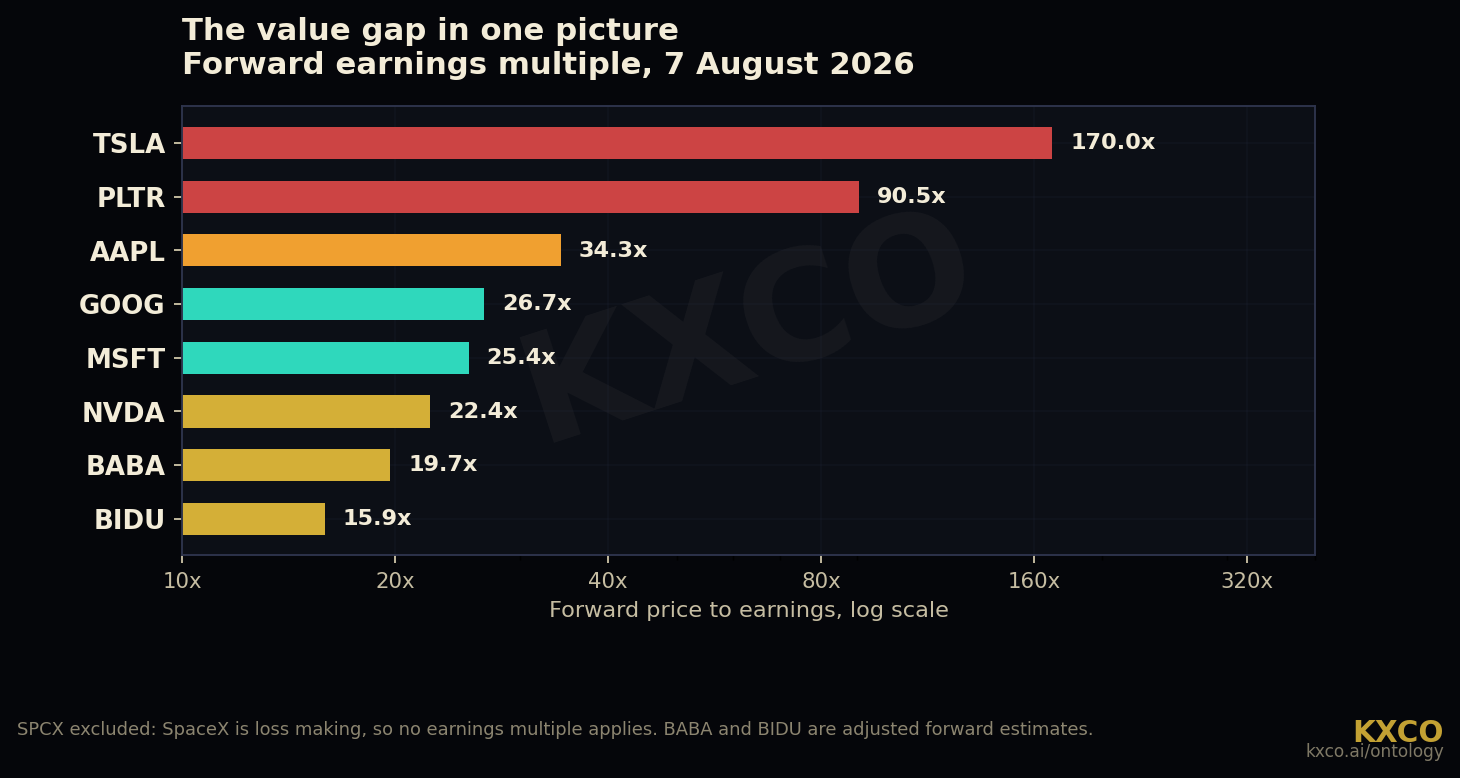
Forward earnings put NVDA around 22 times, below Microsoft, below Alphabet, and well below Apple. First quarter fiscal 2027 revenue was $81.6 billion, up 85% year on year, with data centre revenue of $75.2 billion up 92%, and guidance for the following quarter of about $91 billion against an $86.8 billion consensus. A company growing data centre revenue at 92% trading at 22 times forward is not a story about euphoria. It is a story about a market that does not believe the growth persists.
I believe it persists, because of the shift from training to inference. Training is a capital event. Inference is an operating cost that recurs every time somebody uses the thing, and as agents move into production across enterprises, inference volume compounds while CUDA keeps most of it on Nvidia silicon. The ontology's most critical finding is the same point from the risk side: 52 mapped dependencies route through one vendor, and SpaceX committing on 4 August to build its AI compute exclusively on Vera Rubin deepened that concentration rather than diluting it.
At 5% off the high you are not being paid to be early. Accumulate on down days. Do not chase strength.
Tencent ($0700.HK) and Meta ($META): the two ignored gaps
Tencent trades at HK$495 on 16.9 times earnings with a HK$692 target, 41% away, while AI capital spending has doubled to more than RMB 36 billion and net profit rose 21%. It fell 8.3% over the three weeks to 4 August while its target was raised, which is the cleanest definition of a widening gap there is.
Meta at $588 sits on 22.2 times trailing against a $757 target, 29% away. Second quarter revenue rose 28% and free cash flow fell 91% on capital spending. The market treated that cash flow line as a verdict. I read it as the bill for a build that either produces something or does not, and at 22 times you are not paying much for the option.
Microsoft ($MSFT) and Alphabet ($GOOG): hold, do not trade
MSFT at $499.99 sits 10% off its high on about 25 times forward. The June quarter did the arguing. Revenue was $90.01 billion, up 18%, against roughly $87.6 billion expected. Azure grew 43% and passed $100 billion of annual revenue for the first time, and the September quarter is guided to 45% constant currency growth against a consensus near 41%. The detail worth holding onto is that calendar 2026 capital spending guidance came down, from about $190 billion in April to roughly $175 billion now, while Azure growth accelerated. More output from less spend is the opposite of the AI capex bubble thesis, and it is the cleanest rebuttal of this earnings season.
Alphabet closed Friday at $353.47, down from $375.35 on Monday, which is a 5.8% week in the wrong direction and worth watching. It is a roughly $4.3 trillion company 13% below its high with a $428 target on the map, 13% away. The old pitch, that GOOG was the cheap mega cap trapped under an antitrust cloud, has largely played out: no forced Chrome or Android divestiture, a $4.67 billion EU fine absorbed, and $4 trillion passed in January. The operating case is intact, with Gemini past 750 million monthly active users, serving costs per unit down 78% across 2025, capital spending guided to $175 to $185 billion for 2026, and a custom TPU line becoming a real second front against Nvidia. It is still the mega cap I would own for compute plus model plus distribution in one wrapper. It is no longer a bargain.
Apple ($AAPL): the gap is closed and the story changed
Apple touched $5 trillion on 28 July, briefly passing Nvidia, and has given some back. The shares closed at $313.33 for a $4.57 trillion market capitalisation, 9% below the high, on about 34 times forward earnings. That is the most expensive multiple in this group by a wide margin, and the ontology has it with 4% remaining upside, the second thinnest on the board.
Two things belong in the model. Tim Cook stepped down and John Ternus took over in early August. And the Siri rebuild Apple could not ship on its own is now powered by Google's Gemini models under a commercial agreement, with a beta expected alongside the iPhone 18 line and Apple's first foldable this autumn. The edge AI upgrade cycle is real and I think it lands. But 34 times for a company that outsourced the centrepiece of its AI story and just changed chief executive is a full price. I am underweight.
Tesla ($TSLA): a growth business with an earnings problem
Tesla at $328.58 is 34% below its high. The second quarter explains why. Deliveries of 480,126 were up about 25% and beat consensus by more than 74,000 units. Revenue hit a record $28.2 billion, up 26% and comfortably ahead of the $25.7 billion expected. Then the profit line: adjusted earnings of $0.33 a share against $0.51 expected, operating margin down to 1.4% from 4.1%, and free cash flow of minus $1.09 billion.
Robotaxi is now in seven US markets, three Florida cities launched in July, and Cybercab production has started. That is the spend. Whether it is a good trade depends entirely on whether a 1.4% operating margin is an investment phase or a new normal. At roughly 170 times forward the market is charging for the optimistic answer while the cash flow prints the pessimistic one. I would rather own the autonomy theme where the robotaxi business already generates revenue, which is why Baidu sits higher in this note than Tesla does.
SpaceX ($SPCX): a real business, priced like a story
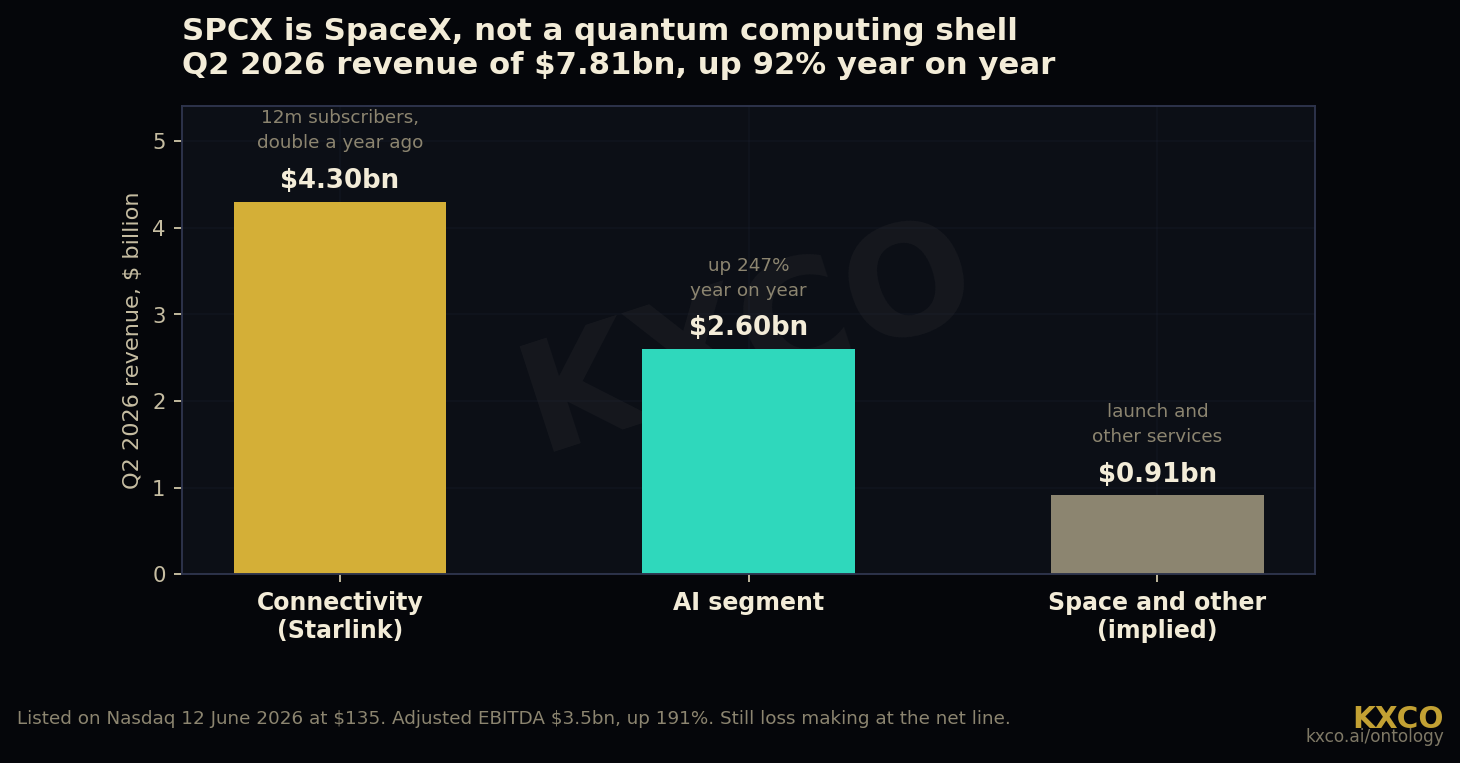
Second quarter revenue was $7.81 billion, up 92% year on year and nearly a billion ahead of the $6.93 billion consensus. Connectivity, which is Starlink, contributed $4.3 billion on 12 million subscribers, double a year ago. The AI segment grew 247% to $2.6 billion. Adjusted EBITDA rose 191% to $3.5 billion. The company is still loss making at the net line, which is why there is no earnings multiple in the chart above.
The share price has told its own story about positioning. SPCX opened at $150 on debut, ran to a $225.64 high by 16 June, closed as low as $108.27 on 5 August, then jumped 15.8% on Friday on 235 million shares as the first major lockup passed on 6 August without a wave of insider selling. Fear of supply, then relief when the supply did not arrive.
One housekeeping note, because this ticker keeps getting misattributed in circulating research and the mistake travels further than the correction. $SPCX is Space Exploration Technologies Corp, the SpaceX listing. It is not Super Micro, which is $SMCI, and it is not a route into a quantum computing shell. I have now seen both errors in print. If you hold it, you own rockets, satellite broadband and AI infrastructure. A ticker is not a thesis. Check what you own.
At $1.75 trillion for a business doing $7.81 billion a quarter, you are paying for Starlink's subscriber curve and the AI segment continuing near its current pace. It is speculative. It is speculative in a real company with real revenue growth, and that distinction is the whole reason the ticker matters.
The rest of the book
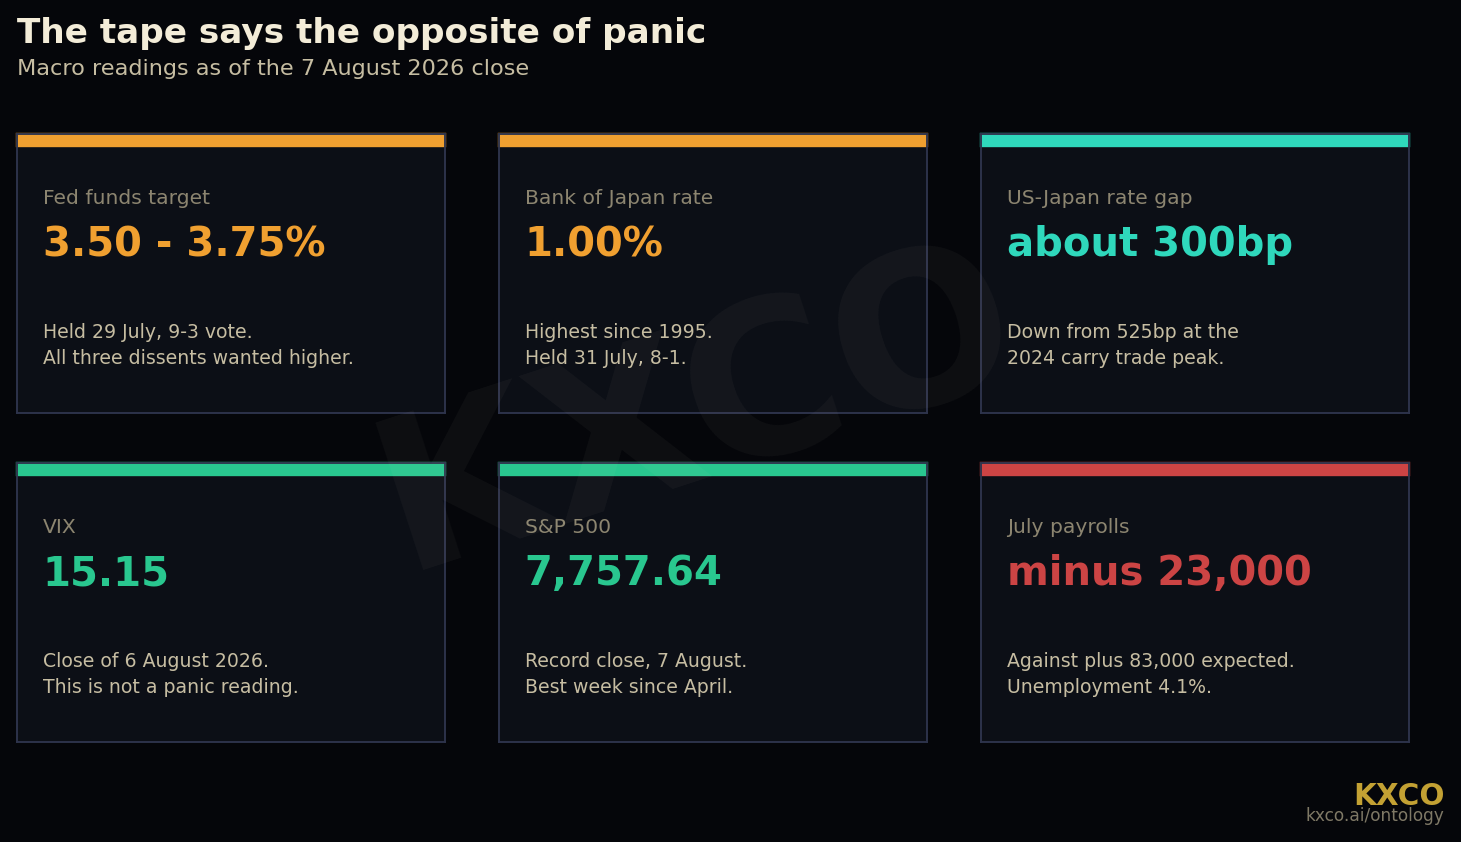
The Fed is on hold and three people want the opposite of a cut. On 29 July the FOMC held at 3.50% to 3.75% on a 9 to 3 vote, with all three dissents from regional presidents who wanted rates higher after more than five years of above target inflation. Dissents in that direction are rare. Anyone telling you a rescue cut is coming is describing a market they would like rather than the one that exists. What changed is Friday: July payrolls fell 23,000 against expectations of a gain near 83,000, government employment fell 53,000, unemployment ticked down to 4.1% only because people left the workforce, and average hourly earnings growth slipped to 3.2%, the slowest since May 2021. That is why September is live, and why Wednesday's CPI is the number of the week.
Gold is the cleanest asymmetry on the board. Spot gold is around $4,350, roughly 22% below the $5,589 intraday record set on 28 January 2026, while the structural bid is unchanged. Central banks added 289 tonnes in the second quarter, the largest quarterly addition since late 2024, led by Poland at 51 tonnes and the People's Bank of China at 33 tonnes. That is dollar diversification being executed slowly by buyers who do not chase. The debt arithmetic behind it is real and worth quoting correctly: federal debt held by the public is around 101% of GDP, gross debt is closer to 125%, and total federal debt is near $39.5 trillion. Those numbers are bad enough without inflating them.
The yen carry trade is a smaller animal than it was. The Bank of Japan held at 1.00% on 31 July, its highest policy rate since 1995, and the US to Japan gap now sits near 300 basis points against roughly 525 at the 2024 peak. The yen has traded around 157 to the dollar, near a forty year low, and there has already been a joint intervention. It is a live risk into a possible September BoJ hike. It is not the invisible hand behind every intraday wobble.
Bitcoin is a bear market, not a dip. BTC is near $64,000 against an all time high of $126,198 set in October 2025, having touched $57,950 on 1 July. That is a 49% drawdown, and 49% down is a different asset from 9% down. The flow evidence has turned though: $626 million of net ETF inflows across the first three sessions of August with no net outflow days this month, against a record $4.51 billion of outflows in June. I am constructive on the flow, not on the halving argument, because the last halving was April 2024 and its supply effect is long since in the price. Size it as the high volatility position it is.
What I am doing this week
The index is at a record, so I am not buying the index.
I am adding to Oracle and Baidu, which carry the two widest gaps on the map, sized for the fact that Oracle carries the most execution risk in the group. I am accumulating Nvidia on down days only, on the multiple rather than the momentum. I hold Alibaba and Tencent as jurisdiction discount positions and I judge Alibaba on cloud margin at the 28 August print. I hold Palantir and I am not adding at 16% remaining upside. Microsoft and Alphabet I hold and do not trade, though Alphabet's 5.8% week is on watch. I am underweight Apple at 34 times into a chief executive transition. I have a small SpaceX position sized as speculation, which is what it is. I am not paying 170 times to guess at Tesla's margin.
I am adding to gold on weakness, because a 22% drawdown against unchanged central bank demand is the cleanest asymmetry available. And I am accumulating Bitcoin slowly, at a size that survives being wrong.
Wednesday's CPI decides how much of that gets executed at better prices. If inflation cools for a second month the September cut prices in and the gaps start closing on their own. If it runs hot, the tape gives you a week of entries. Either outcome is workable. What is not workable is buying the whole board on Monday because Friday felt good.
Stay long. Stay selective. The two are the same discipline.
Sources
Market levels and index closes
CNBC, S&P 500 rises to record close Friday and posts strongest week since April, 7 August 2026
NBC News, Nasdaq-100 slides into correction as global chip and memory stocks sell off
Stock Analysis, daily price history for PLTR, SPCX, ORCL and GOOG, closes to 7 August 2026
This week's calendar
LiteFinance, Forex Economic Calendar: key events for 10 to 16 August 2026
Federal Reserve, FOMC meeting calendar, September 2026 meeting dates
Cisco Systems, Cisco Schedules Conference Call for Q4 Fiscal Year 2026 Financial Results
Macroeconomic data
CNBC, Consumer price index inflation report June 2026, released 14 July 2026
US Census Bureau, Monthly Retail Trade Survey, June 2026 advance report
University of Michigan, Consumer confidence rises for second straight month, July 2026 final
CNBC, Fed rate decision July 2026: Divided Fed holds interest rates steady, 29 July 2026
Bureau of Labor Statistics, The Employment Situation, July 2026
Tech Times, Bank of Japan Holds Rates at 1% as Yen Nears 40-Year Low, 27 July 2026
Congressional Budget Office, The Budget and Economic Outlook: 2026 to 2036, February 2026
Gold and Bitcoin
CBS News, What is the highest gold price in history, $5,589.38 intraday on 28 January 2026
World Gold Council data reported via CaptainAltcoin, central banks add 289 tonnes in Q2 2026
Crypto Ticker, Bitcoin ETF inflows August 2026, $626 million across the first three sessions
Trading Key, Can Bitcoin Hit a New All-Time High in 2026, ATH $126,198 on 6 October 2025
Company results
Nvidia, NVIDIA Announces Financial Results for First Quarter Fiscal 2027
CNBC, Apple touches $5 trillion market cap for first time, 28 July 2026
Yahoo Finance, Apple tops $5 trillion market cap, including the Gemini agreement for Siri
Electrek, Tesla releases Q2 2026 financial results: record revenue, big profit miss, 22 July 2026
StartupHub, SPCX Surges 16%: Lockup Expiration Passes Cleanly, 7 August 2026
Baidu, Baidu Announces First Quarter 2026 Results, Apollo Go ride volumes
TS2, Alibaba shares give up Qwen gains as market focus turns to cloud margins
Phemex, Alphabet stock in 2026: AI dominance, capex bet, antitrust risk
KXCO references
KXCO, Enterprise Ontology for AI: A Working Digital Twin of the Business
Live Trading News, SpaceX: The AI Company You Might Be Missing, 22 July 2026
Disclaimer: The views expressed here are those of Shayne Heffernan and are for information and education only. Nothing above is a recommendation to buy or sell any security. Equities, cryptocurrencies and recently listed companies carry a high degree of risk including the total loss of capital, and SPCX in particular is a loss making company that has been publicly traded for under two months with a share price that has ranged from a $225.64 high to a $108.27 close inside that period. Chinese ADRs carry additional regulatory and delisting risk. Consensus price targets are twelve month estimates published by third party analysts, not forecasts by KXCO or Live Trading News. Past performance says nothing about future results. Prices and figures are as at the close of 7 August 2026 and will have moved. Do your own research and speak to a licensed adviser before acting.
Graphics produced by KXCO. Data as at the 7 August 2026 close unless otherwise stated.
The 2030 Compute Landscape: GPUs, Power and the Architecture of Intelligence
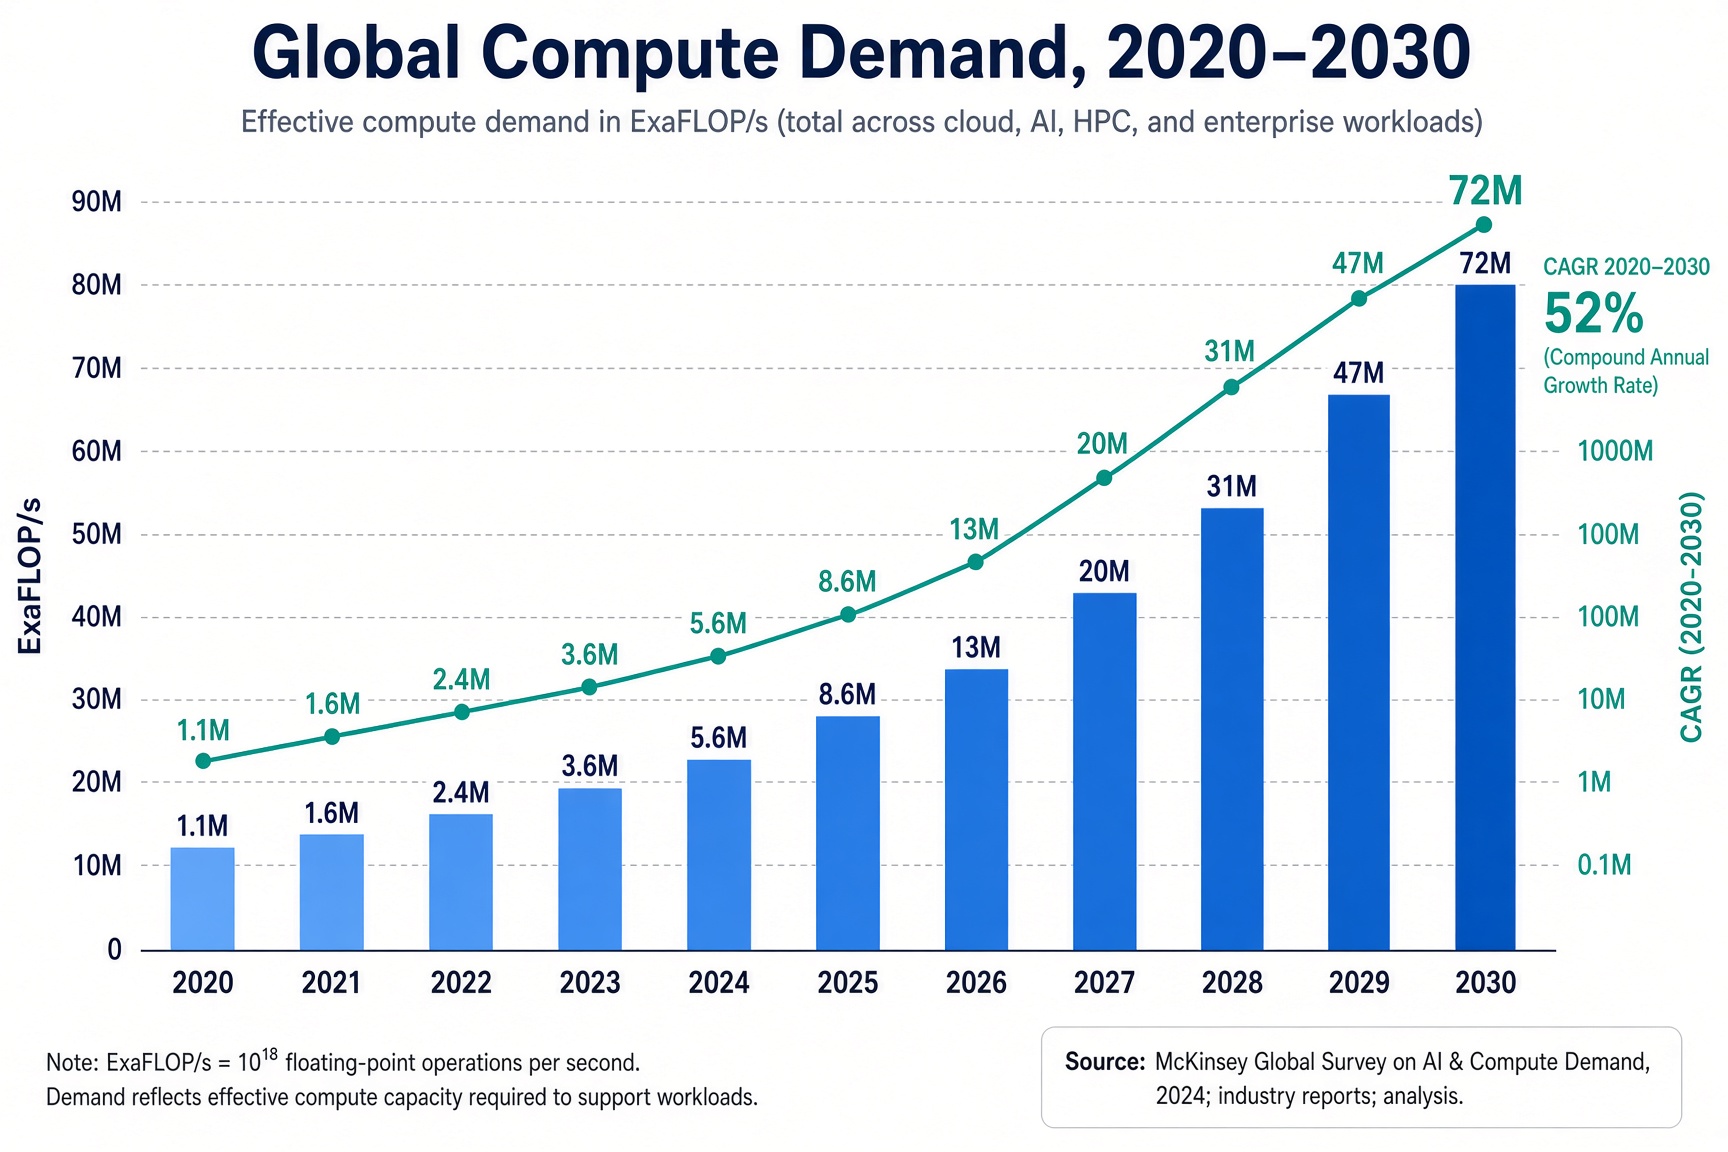
The constraint on AI is no longer ideas or data but compute and the power to run it. Frontier training compute has grown about five times a year since 2020, and the leading AI supercomputer of June 2030 is on course for about 2 million chips and 9 gigawatts. Shayne Heffernan sets out the 2030 arithmetic, the power problem, who has already contracted the gigawatts, and how GPUs, custom ASICs, wafer-scale engines and quantum machines divide the work.

How Can You Trust AI When You Cannot Trust Humans?
Can you trust AI? Can you trust humans? More often than we like to admit, the answer is no. AI inherits its failures from the human records it is trained on. Sheikh Mohammed bin Rashid wrote this month that the currency the UAE is betting on is trust. This piece sets out what a trust layer has to do, shows the method on three public knowledge graphs, and lays out the post-quantum work KXCO has published so that an institution can check the claim rather than take it.
KXCO AI Ontology at 3 Months: What It Called and What Comes Next
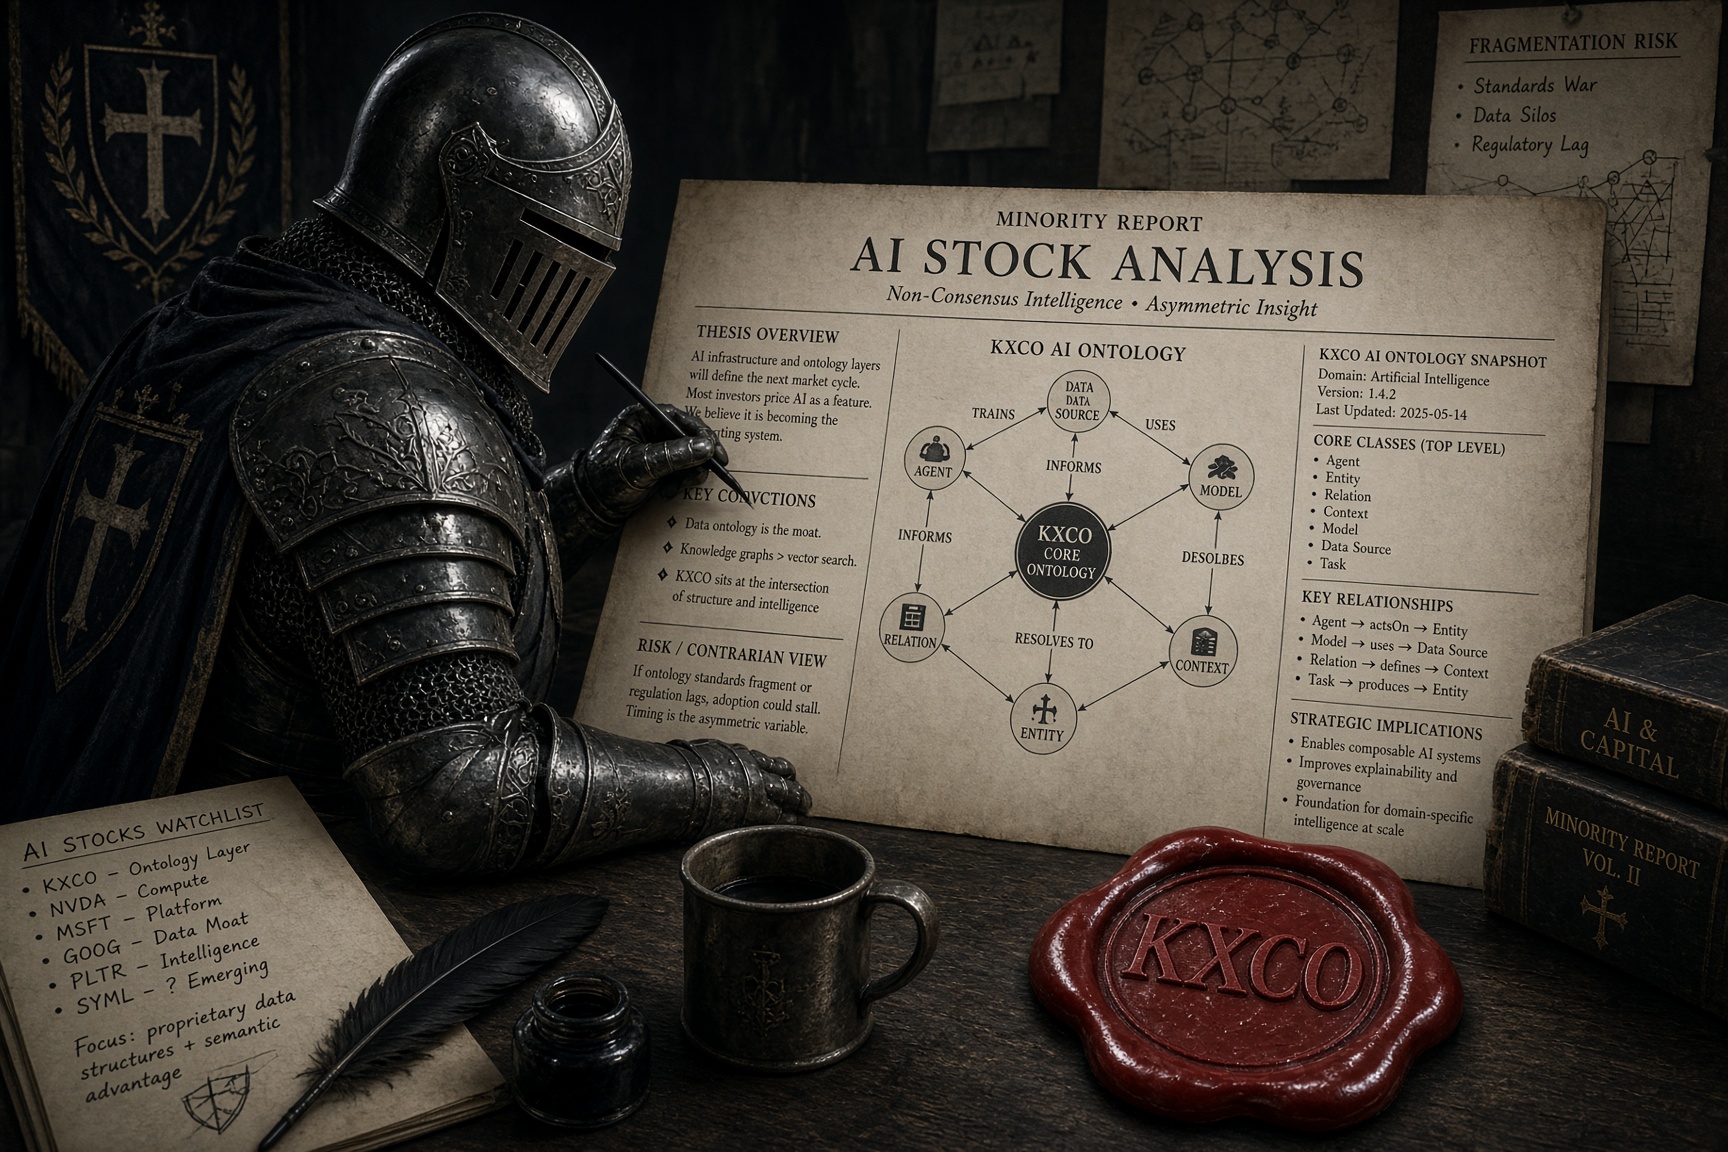
On 19 July 2026 the Round Table's AI room published its first Analyst Outlook. To the 16 October 2026 close its 13 names rose 2.6% on an equal weight against 2.1% for QQQ, per StockAnalysis closes, and the six it opened with 35% or more of upside rose 8.6%. This piece lists the six names up more than 5%, the ten names I rate as opportunities now, the month's results in AI and quantum computing, and the official data showing that four in five firms have not yet started using AI.

SpaceX: The Road to 10 Gigawatts
SpaceX did not add an AI business. A company whose processes run on compute built its own computing plant, then built the power to run it. The 10-Q reports 1.4 gigawatts of nameplate compute at 30 June 2026, four leases worth about $41 billion a year and $100 billion of cash. The target is closer to 10 gigawatts than 5 by the end of 2027. This piece sets out the build sequence, the four layers of power in Memphis, and why Terafab is the act after 2027, not the road to it.
Every story, signed and delivered.
Subscribe to the kxco channel and get the headline, the AI-written key takeaways, and the chain-anchor link the moment we publish. Audio versions and per-ticker subscriptions arrive in the next iteration.