The number of foreign tourist arrivals, after seasonal adjustment, increased from the previous month in several nationalities, especially tourists from Malaysia and China due to a long holiday in both countries. Nonetheless, tourist arrivals from Europe and Middle East declined slightly after a good expansion in the previous period.
The value of merchandise exports, excluding gold and after seasonal adjustment, improved from the previous month, especially in agricultural products, following durian exports to China, as well as electronics products due to export delivery cycle of hard-disk drive to the U.S. and Europe. However, export of agro-manufacturing products decreased from lower palm oil exports to India, while export of electrical appliances also declined after accelerated in preceding period.
Manufacturing production, after seasonal adjustment, remained at a similar level from the previous month. The production of petroleum products increased as production resumed after a temporarily closure of an oil refinery for maintenance. Production of metal also increased as metal imports from China became lower. However, the production in several categories decreased due to the slowdown in trading partner’s demand, including sugar and rubber product.
Private consumption indicators, after seasonal adjustment, slightly decreased from the previous month in almost all categories. Spending on durable goods declined due to lower sales of passenger cars after a good expansion in the preceding period. Meanwhile, spending on the service sector became flat. The factors supporting household spending continued to improve both in terms of employment and consumer confidence, in spite of elevated living costs which continued to exert downward pressure on consumption.
Private investment indicators, after seasonal adjustment, declined from the previous month. Investment in machinery and equipment dropped after import of capital accelerated in the previous month. Investment in construction also decreased, following lower sales of construction materials. Permitted area for construction, however, increased mainly from area for manufacturing purposes.
The value of merchandise imports, excluding gold and after seasonal adjustment, decreased from the previous month due to lower imports of 1) capital goods after accelerated in preceding period 2) raw materials and intermediate goods, excluding fuel, following a lower import of metal and 3) consumer goods such as electric appliances, electric vehicles, and drugs. However, import of fuel increased from imports of natural gas.
Public spending, excluding transfer payments, contracted from the same period last year. In terms of the central government, current expenditures contracted after having front-loaded its disbursement of personnel compensation in the preceding period, together with the high base last year due to disbursement of budget related to COVID-19. Capital expenditures also contracted due to front-loaded disbursements of transportation and irrigation projects. Investments by state-owned enterprises contracted because of lower disbursements in energy and transportation projects.
On the stability front, headline inflation declined mainly from lower raw food prices, following decreases in pork and vegetable prices due to higher supply in the market. Core inflation also decreased due to high base effects of prepared food prices as well as prices of seasoning and condiment categories last year. The labor market continued to improve as reflected by increases in the number of insured persons in the social security system. The current account registered a surplus from a better trade balance thanks to improvement in export. In addition, the services, income, and transfers balance registered a smaller deficit due to lower remittance outflow of profits and dividends by foreign businesses, together with lower intellectual property payments. As for exchange rates, the baht against the US dollar, on average, depreciated from the previous month following the depreciation of Chinese Yuan due to China’s weaker-than-expected economic growth.
In the second quarter of 2023, the Thai economy displayed a moderate improvement from the previous quarter. The number of Thai and foreign tourists increased, and the service sector and private consumption expanded. Private investment also improved, partly from investment in new industries. The merchandise exports, excluding gold, increased slightly from agricultural product. Manufacturing production, however, declined mainly from the production of cars as well as food and beverages. Public spending contracted from current expenditure of central government and the investment of state-owned enterprises. On the economic stability front, headline and core inflation decreased due to the high base last year in conjunction with lower energy prices. The labor market continued to improve in line with the economic recovery. The current account registered a deficit due to the remittance outflow of profits and dividends by foreign businesses, together with a lower tourist receipt due to seasonal factor, as well as a smaller surplus in the trade balance.
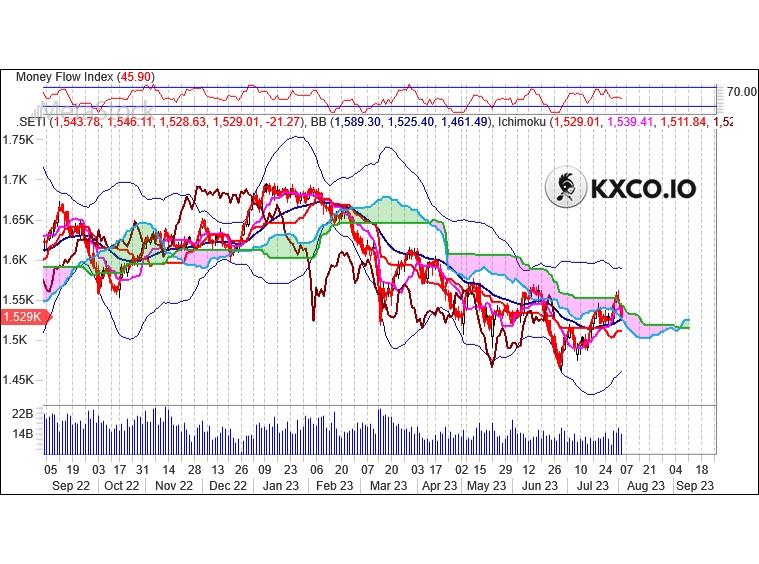
Technicals
Candlesticks
A big black candle occurred. This is bearish, as prices closed significantly lower than they opened. If the candle appears when prices are “high,” it may be the first sign of a top. If it occurs when prices are confronting an overhead resistance area (e.g., a moving average, trendline, or price resistance level), the long black candle adds credibility to the resistance. Similarly, if the candle appears as prices break below a support area, the long black candle confirms the failure of the support area.
During the past 10 bars, there have been 4 white candles and 6 black candles for a net of 2 black candles. During the past 50 bars, there have been 24 white candles and 26 black candles for a net of 2 black candles.
A falling window occurred (where the bottom of the previous shadow is above the top of the current shadow). This usually implies a continuation of a bearish trend. There have been 3 falling windows in the last 50 candles–this makes the current falling window even more bearish.

Momentum is a general term used to describe the speed at which prices move over a given time period. Generally, changes in momentum tend to lead to changes in prices. This expert shows the current values of four popular momentum indicators.
Stochastic Oscillator
One method of interpreting the Stochastic Oscillator is looking for overbought areas (above 80) and oversold areas (below 20). The Stochastic Oscillator is 61.7764. This is not an overbought or oversold reading. The last signal was a sell 0 period(s) ago.
Relative Strength Index (RSI)
The RSI shows overbought (above 70) and oversold (below 30) areas. The current value of the RSI is 51.53. This is not a topping or bottoming area. A buy or sell signal is generated when the RSI moves out of an overbought/oversold area. The last signal was a buy 23 period(s) ago.
Commodity Channel Index (CCI)
The CCI shows overbought (above 100) and oversold (below -100) areas. The current value of the CCI is 34. This is not a topping or bottoming area. The last signal was a sell 0 period(s) ago.
MACD
The Moving Average Convergence/Divergence indicator (MACD) gives signals when it crosses its 9 period signal line. The last signal was a buy 15 period(s) ago.
Technical Outlook
Short Term: Neutral
Intermediate Term: Bullish
Long Term: Bullish
Short-term traders should pay closer attention to buy/sell arrows while intermediate/long-term traders should place greater emphasis on the Bullish or Bearish trend reflected in the lower ribbon.
Summary
SET Index(Trade Price) gapped down today (bearish) on normal volume. Possibility of a Runaway Gap which usually signifies a continuation of the trend. Four types of price gaps exist – Common, Breakaway, Runaway, and Exhaustion. Gaps acts as support/resistance.
SET Index(Trade Price) is currently 4.0% below its 200-period moving average and is in an upward trend. Volatility is relatively normal as compared to the average volatility over the last 10 periods.
Our volume indicators reflect volume flowing into and out of .SETI at a relatively equal pace (neutral).
Our trend forecasting oscillators are currently bullish on .SETI and have had this outlook for the last 9 periods.
Shayne Heffernan


