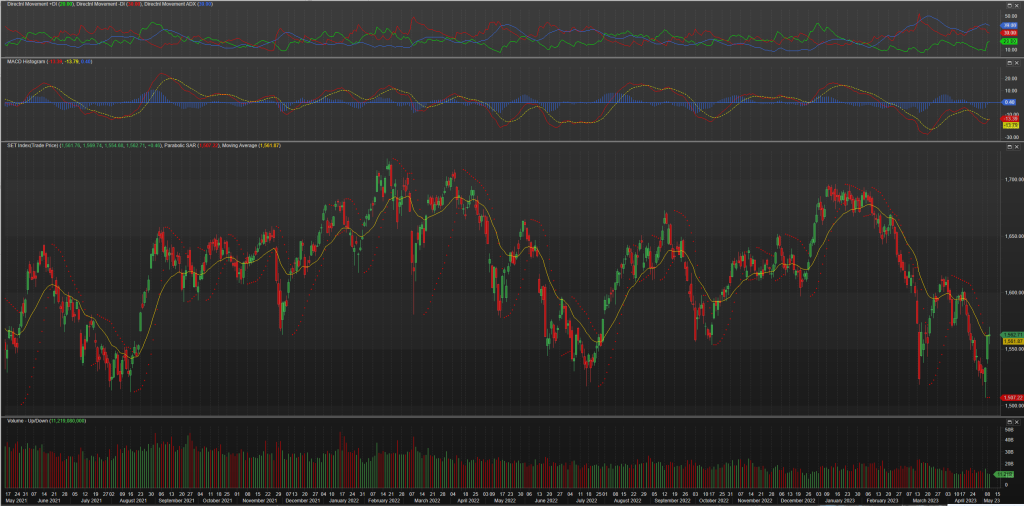
SET Index(Trade Price) closed up 0.430 at 1,562.680. Volume was 29% below average (neutral) and Bollinger Bands were 26% wider than normal.
Technical Outlook
- Short Term: Neutral
- Intermediate Term: Bearish
- Long Term: Bearish
Thailand Stock Investor Confidence Index At 110.09 In April Survey Versus 95.65 In March – Capital Market Group Fetco – Reuters News
SET and SZSE joins forces for mutual display of indices to connect investment opportunities
In 2019, the Stock Exchange of Thailand (SET) and the Shenzhen Stock Exchange (SZSE) signed an MOU aimed at expanding opportunities for Thai and Chinese securities and establishing connections between both stock exchanges. One of the collaboration’s objectives was to offer more fundraising options through cross-border product development, cooperation on indices, and annual roadshows. In a bid to promote Thai and Chinese securities, both exchanges have recently shared their investment data and key indices to be disseminated through each market’s main channels. This move will provide investors with greater access to information on listed securities and the cross-market index display service is now available.

30-day free trial link showcasing MetaStock and its charting power.
Summary
SET Index(Trade Price) is currently 3.4% below its 200-period moving average and is in an downward trend. Volatility is extremely high when compared to the average volatility over the last 10 periods. There is a good possibility that volatility will decrease and prices will stabilize in the near term. Our volume indicators reflect moderate flows of volume out of .SETI (mildly bearish). Our trend forecasting oscillators are currently bearish on .SETI and have had this outlook for the last 7 periods.
Candlesticks
A white body occurred (because prices closed higher than they opened).
During the past 10 bars, there have been 5 white candles and 5 black candles. During the past 50 bars, there have been 20 white candles and 30 black candles for a net of 10 black candles.
A spinning top occurred (a spinning top is a candle with a small real body). Spinning tops identify a session in which there is little price action (as defined by the difference between the open and the close). During a rally or near new highs, a spinning top can be a sign that prices are losing momentum and the bulls may be in trouble.
Three white candles occurred in the last three days. Although these candles were not big enough to create three white soldiers, the steady upward pattern is bullish.
Bollinger Band
On 5/9/2023, SET Index(Trade Price) closed above the lower band by 47.0%.
Bollinger Bands are 34.13% wider than normal. The current width of the bands (alone) does not suggest anything conclusive about the future volatility or movement of prices.
The recent price action around the bands compared to the action of the Relative Strength Index (RSI) does not suggest any trading opportunities at this time.


