Republican Congressman Mark Green of Tennessee purchased between $100,000 and $250,000 worth of stock in NGL Energy Partners LP, a midstream oil and gas service provider, on June 8th, 2023. He filed the trade with the House Ethics Committee on June 12th, 2023, after a 4-day waiting period.
Green also sold between $100,000 and $250,000 worth of stock in Energy Transfer LP, a midstream energy company, on June 8th, 2023. He filed the trade with the Ethics Committee on June 12th, 2023.
Mark Green is a member of the House Energy and Commerce Committee, which oversees the energy industry. Green has said that his trades were made in accordance with the STOCK Act, a federal law that requires members of Congress to disclose their financial transactions.
NGL Energy Partners
NGL Energy Partners LP is a diversified midstream energy partnership that transports, treats, recycles, and disposes of produced water generated as part of the energy production process as well as transports, stores, markets and provides other logistics services for crude oil and liquid hydrocarbons. The Company’s Water Solutions segment transports, treats, recycles, and disposes of produced and flowback water generated from crude oil and natural gas production. Its Crude Oil Logistics segment purchases crude oil from producers and marketers and transports it to refineries or for resale at pipeline injection stations, storage terminals, barge loading facilities, rail facilities, refineries, and other trade hubs, and provides storage, terminaling, and transportation services through its owned assets. Its Liquids Logistics segment conducts supply operations for natural gas liquids, refined petroleum products and biodiesel to a range of commercial, retail, and industrial customers.
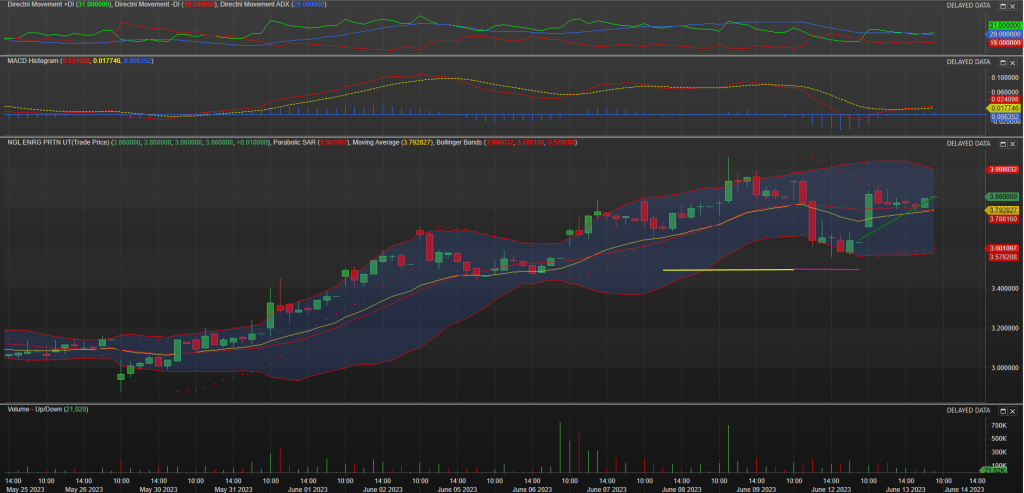
Technical Outlook
Short Term: Neutral
Intermediate Term: Bearish
Long Term: Bullish

*Yellow line in days in pending
**Purple line is day filled
Summary
NGL ENRG PRTN UT(Trade Price) gapped up today (bullish) on light volume. Possibility of a Common Gap which usually coincides with a lack of interest in the security. Common Gaps are fairly irrelevant for forecasting purposes. Four types of price gaps exist – Common, Breakaway, Runaway, and Exhaustion. Gaps acts as support/resistance.
Candlesticks
During the past 10 bars, there have been 4 white candles and 4 black candles. During the past 50 bars, there have been 20 white candles and 23 black candles for a net of 3 black candles.
A doji star occurred (where a doji gaps above or below the previous candle). This often signals a reversal with confirmation occurring on the next bar.
A gravestone doji occurred. This often signifies a top (the longer the upper shadow, the more bearish the signal).
A rising window occurred (where the top of the previous shadow is below the bottom of the current shadow). This usually implies a continuation of a bullish trend. There have been 4 rising windows in the last 50 candles–this makes the current rising window even more bullish.
Bollinger Bands
On 6/13/2023 5:00 PM, NGL ENRG PRTN UT(Trade Price) closed below the upper band by 32.9%.
Bollinger Bands are 68.97% wider than normal. The large width of the bands suggest high volatility as compared to NGL ENRG PRTN UT(Trade Price)’s normal range. Therefore, the probability of volatility decreasing and prices entering (or remaining in) a trading range has increased for the near-term. The bands have been in this wide range for 14 period(s). The probability of prices consolidating into a less volatile trading range increases the longer the bands remain in this wide range.
The recent price action around the bands compared to the action of the Relative Strength Index (RSI) does not suggest any trading opportunities at this time.
Energy Transfer LP
Energy Transfer LP is engaged in natural gas operations and natural gas midstream and intrastate transportation and storage activities. The Company offers crude oil, natural gas liquid (NGL) and refined products. The Company’s segments include intrastate transportation and storage; interstate transportation and storage; midstream; NGL and refined products transportation and services; crude oil transportation and services; investment in Sunoco LP; investment in USAC; and all other. The intrastate transportation and storage segment and interstate transportation and storage consist of natural gas transportation pipelines, which receive natural gas from other mainline transportation pipelines, storage facilities and gathering systems and deliver the natural gas to industrial end-users, storage facilities, utilities, power generators and other third-party pipelines. The midstream segment consists of natural gas gathering, compression, treating, processing, storage, and transportation.
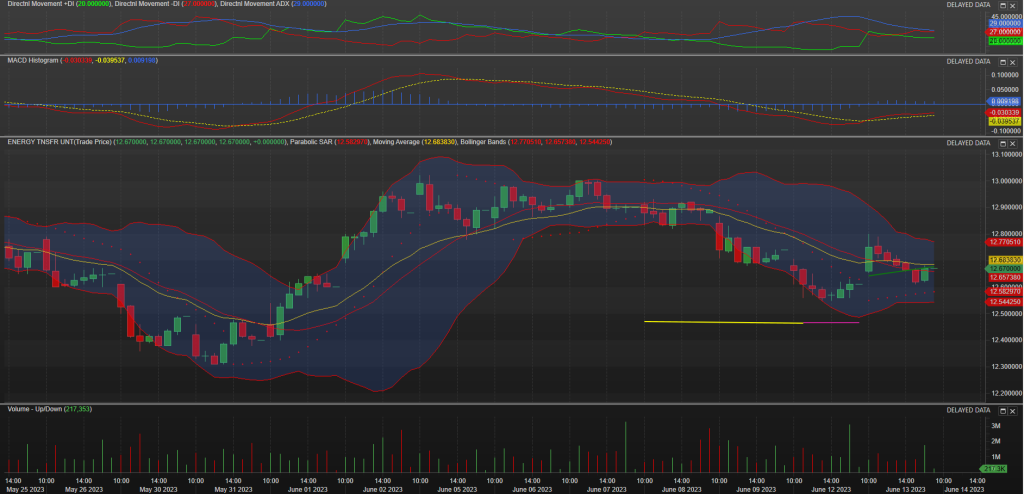
Technical Outlook
Short Term: Neutral
Intermediate Term: Bearish
Long Term: Bullish

*Yellow line in days in pending
**Purple line is day filled
Summary
ENERGY TNSFR UNT(Trade Price) is currently 0.3% above its 200-period moving average and is in an downward trend. Volatility is extremely low when compared to the average volatility over the last 10 periods. There is a good possibility that there will be an increase in volatility along with sharp price fluctuations in the near future. Our volume indicators reflect volume flowing into and out of ET at a relatively equal pace (neutral). Our trend forecasting oscillators are currently bearish on ET and have had this outlook for the last 35 periods.
Candlesticks
During the past 10 bars, there have been 3 white candles and 5 black candles for a net of 2 black candles. During the past 50 bars, there have been 18 white candles and 23 black candles for a net of 5 black candles.
A gravestone doji occurred. This often signifies a top (the longer the upper shadow, the more bearish the signal).
Bollinger Bands
On 6/13/2023 5:00 PM, ENERGY TNSFR UNT(Trade Price) closed below the upper band by 44.4%.
Bollinger Bands are 29.81% narrower than normal. The current width of the bands (alone) does not suggest anything conclusive about the future volatility or movement of prices.
The recent price action around the bands compared to the action of the Relative Strength Index (RSI) does not suggest any trading opportunities at this time.


