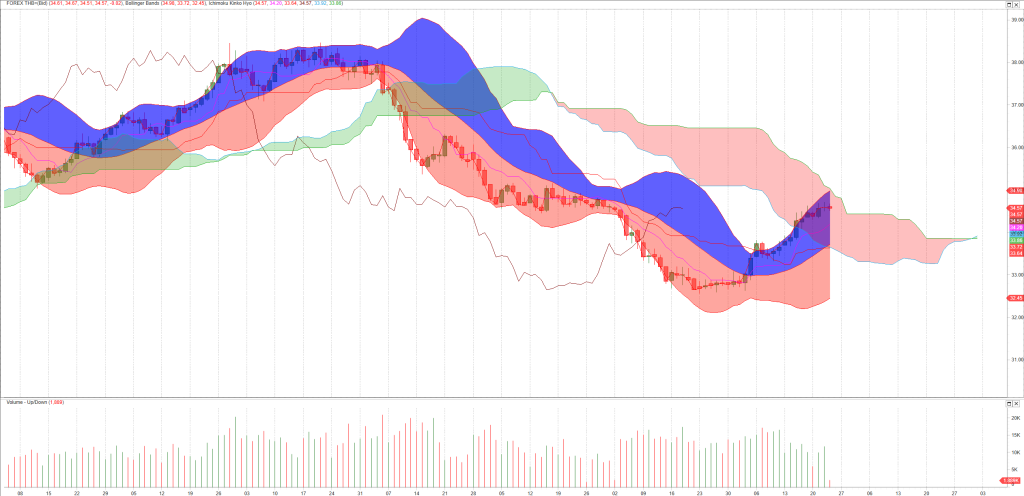
USDTHB KXCO outlook
Several years of strong export growth in Thailand may continue, but a stronger baht is not helping exports. The ministry predicted the baht to average 32.5 per dollar this year after 35.07 last year, as Thailand is among countries that are expected to have a continued economic recovery
- Maintains 2023 GDP growth outlook at 3.8%, cuts 2022 estimate
- Raises 2023 foreign tourist forecast to 27.5 mln from 21.5 mln
- Cuts 2023 export growth forecast to +0.4% from +2.5%
- Sees average baht strengthening, inflation easing this year
Over the last four decades, Thailand has made remarkable progress in social and economic development, moving from a low-income to an upper middle-income country in less than a generation. As such, Thailand has been a widely cited development success story, with sustained strong growth and impressive poverty reduction. Thailand’s economy grew at an average annual rate of 7.5% in the boom years of 1960-1996 and 5% during 1999-2005 following the Asian Financial Crisis. This growth created millions of jobs that helped pull millions of people out of poverty. Gains along multiple dimensions of welfare have been impressive: more children are getting more years of education, and virtually everyone is now covered by health insurance while other forms of social security have expanded.
A strong run of U.S. economic data recently have raised expectations that the Fed will stay on its rate-hike path for longer than earlier thought, and hawkish comments from Fed officials have also supported the dollar.
- Baht seen to average 32.50 to a dollar this year: ministry
- Ministry retains 2023 GDP target at 3.8%; cuts 2022 estimate
- Thai IPOs will benefit from baht, tourism outlook: JPMorgan
- Foreign investors’ renewed interest will bolster new IPOs
- Q4 GDP -1.5% q/q vs +0.5% in Reuters poll
- Q4 GDP +1.4% y/y vs +3.5% in Reuters poll
- 2022 GDP +2.6% vs +3.3% in poll, +1.5% in 2021
- 2023 GDP growth seen at 2.7-3.7% vs 3.0-4.0% seen earlier
Elections that will be held no later than May should also help domestic consumption.
China’s visitors are back, Thailand will receive 28 million foreign tourist arrivals this year, up from the 23.5 million projected earlier.
Thailand beat its tourism target in 2022 with 11.15 million foreign visitors. It welcomed a record of nearly 40 million visitors in pre-pandemic 2019, who spent 1.91 trillion baht ($55.75 billion).
Technicals
USDTHB is currently 2.8% below its 200-period moving average and is in an upward trend. Volatility is relatively normal as compared to the average volatility over the last 10 periods. Our volume indicators reflect moderate flows of volume into USDTHB (mildly bullish). Our trend forecasting oscillators are currently bullish on USDTHB and have had this outlook for the last 11 periods. Our momentum oscillator is currently indicating that THB= is currently in an overbought condition.
Get MetaStock for 3 months for the price of only 1
USDTHB closed down -0.030 at 34.560. Volume was 85% below average (consolidating) and Bollinger Bands were 30% wider than normal.
Technical Outlook
Short Term: Overbought
Intermediate Term: Bullish
Long Term: Bearish
Short-term traders should pay closer attention to buy/sell arrows while intermediate/long-term traders should place greater emphasis on the Bullish or Bearish trend reflected in the lower ribbon.
FOREX THB=(Bid) closed down -0.0300 at 34.5600 on volume 84.93% below average. Bollinger Bands are 30.17% wider than normal.
Open 34.610
High 34.670
Low 34.510
Close 34.560
Volume 1,891
Moving Averages:
Close:
Volatility:
Volume:
10-period
34.25
7
10,178
50-period
33.77
10
11,787
200-period
35.55
10
10,533
Period=Daily
10-period
21-period
39-period
90-period
Statistical Volatility
6.9368
8.6377
10.5489
11.7089
Change from Previous period
0.43
0.05
0.00
-0.01

The Stochastic Oscillator is 80.0001. This is an overbought reading. However, a signal is not generated until the Oscillator crosses below 80 The last signal was a sell 3 period(s) ago.
The current value of the Relative Strength Index (RSI) is 70.31. This is where it usually tops. The RSI usually forms tops and bottoms before the underlying security. A buy or sell signal is generated when the RSI moves out of an overbought/oversold area. The last signal was a sell 3 period(s) ago.
Bollinger Bands are 48.75% wider than normal. The large width of the bands suggest high volatility as compared to FOREX THB=(Bid)’s normal range. Therefore, the probability of volatility decreasing and prices entering (or remaining in) a trading range has increased for the near-term. The bands have been in this wide range for 4 period(s). The probability of prices consolidating into a less volatile trading range increases the longer the bands remain in this wide range.
The recent price action around the bands compared to the action of the Relative Strength Index (RSI) does not suggest any trading opportunities at this time.
The Commodity Channel Index (CCI) shows overbought (above 100) and oversold (below -100) areas. The current value of the CCI is 91. This is not a topping or bottoming area. The last signal was a sell 0 period(s) ago.
The Moving Average Convergence/Divergence indicator (MACD) gives signals when it crosses its 9 period signal line. The last signal was a buy 20 period(s) ago.
About KXCO.io
Under the name Knightsbridge KXCO became one of Asia’s leading financial services companies with interests in Institutional investment, Private Equity, Capital Markets, Publishing, and Agriculture that span every continent of the world. We have unprecedented experience in Equities, Banking, Private Equity, Trading and Funds Management.
Managing and Protecting wealth is important, KXCO can show you and your clients how to realise profits and gain protection by utilizing the Global Markets.


